By S. Lynch-Benttinen
[email protected]
Copyright 2008-2025
Extremely Small Differential Gravity Readings from Space Towards Earth Highlight Mass Moving Spacetime as Predicted by Einstein
This paper was written to explain the The Grace Blue Red Theory. The GBRT states that minute gravity data taken from the difference of two orbiting satellites above Earth when graphically shown on global maps show relativistic movement of mass as predicted by Einstein. These maps are useful to show ancient geological movements and explain past large scale geological movements. This paper requires a knowledge of physics, relativity, and ancient geology.
UPDATE – July 2019- Following the original GRACE program there is now a Follow On (FO) program-
“The NASA/German Research Centre for Geosciences GRACE Follow-On spacecraft launches onboard a SpaceX Falcon 9 rocket, Tuesday, May 22, 2018, from Space Launch Complex 4E at Vandenberg Air Force Base in California. The mission will measure changes in how mass is redistributed within and among Earth’s atmosphere, oceans, land and ice sheets, as well as within Earth itself. GRACE-FO shared its ride to orbit with five Iridium NEXT communications satellites as part of a commercial rideshare agreement.” NASA/German Research Centre for Geosciences
GRACE FO stands for Gravity Recovery and Climate Experiment Follow-on. The new GRACE FO program will generate water, land, and climate data, along with gravity maps. https://podaac.jpl.nasa.gov/GRACE-FO
The Grace Blue Red Theory states that static free air gravity data taken from two satellites 300 miles above earth corresponds to to Einstein’s understanding of gravity, “mass warping space-time”. The data is taken in real time above earth, yet the static free air maps shows ancient movements of mass. The maps can help geologists understand ancient geological movements on earth. -July 2019
2008 Introduction This paper introduces a theory that ancient geological data on Earth can be found in visual gravity data taken from two satellites by the GRACE project, as predicted by Einstein’s Theory of General Relativity that explains how gravity warps space/time. This paper will explain the difference between gravity interpreted by geophysicists on Earth, and gravity interpreted by astrophysicists from space. The theory shows how gravity data on earth actually corresponds to density variations, but from space corresponds to mass movements. The paper will show some of the visual ancient geological events corresponding to gravity anomolies taken from microwave sensing gravity data from satellites. This theory can be proven with critical thinking and evidence based analysis of geological data on the ground where gravity anomalies taken from satellite data can be matched to ancient events.
The Grace Blue Red Theory states specifically that “The gravity data and corresponding color coded maps of the Gravity Recovery and Climate Experiment satellites, conducted by CSR, JPL, NASA, GFZ, and DLR, launched in 2002, have produced gravity data that conforms to General Relativity, showing the movement of mass warping space/time. The data shows past geologic events that will add to our knowledge of Earth’s geologic history”.
For this theory to be scientific, it must be able to be tested, and have the potential to be proven wrong. The testing of this theory is completed by matching the geology on the ground to the satellite data.
What is gravity? On Earth gravity follows Newton’s insights and formulas from 1687 in his “Principia”, now known as Classical Mechanics. But he did not solve one problem; what is gravity? He knew it needed further elucidation, and he wrote “I have not as yet been able to deduce from phenomena the reason for these properties of gravity, and I do not feign hypotheses”.
Centuries later Albert Einstein wrote, “One day in 1907 “there came to me the happiest thought of my life,” namely that “the gravitational field has only a relative existence.” “The theory of relativity is intimately connected with the theory of space and time.” Einstein’s general theory of relativity states that objects with mass cause a curvature in space-time, which we perceive as gravity. Space-time, according to Einstein’s theories of relativity, is a four-dimensional fabric woven together by space and time. He came to the amazing conclusion, which has been proven again and again, that gravity is the warping of space/ time. Einstein wrote that gravity readings on earth will follow Classical Mechanics, or “Galilean” as he called traditional physics. “We can therefore always regard an infinitesimally small region of the space-time continuum as Galilean.but that at great distances, such as in space outside Earth, a relativistic analysis of gravity is needed”. “This interpretation is even more plausible according to general relativity which eliminates the distinction between inertial and gravitational effects. It amounts to stipulating that, apart from the arbitrariness governed by the free choice of coordinates, the field shall be completely determined by the matter“.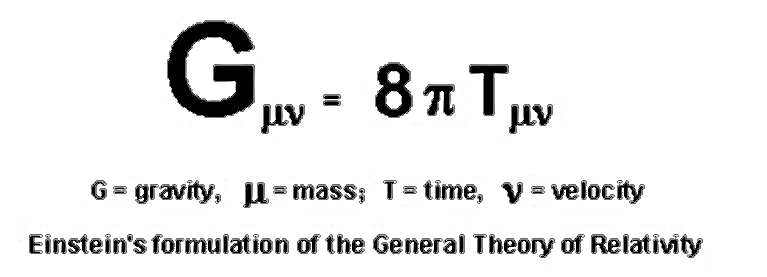
The equation for General Relativity looks simple, but is actually quite complex with vectors and four dimensions. In simple terms Einstein’s formula for General Relativity explains that the curvature of Space/Time is equal to the distribution of mass and energy, with time being relative. The equation introduces vectors of dimensions related to mass, time, velocity, and space. Einstein’s separate field equations are necessary for small changes to satellites, such as used for GPS co-ordinates, to account for real time changes due to relativity. Lens -Thirring effect calculations are also small changes in satellite readings in a spinning geoid. But the General Relativity formula shows the curvature of space equals the distribution of mass and energy, and that the geometry of gravity is influenced by mass which can curve space time. On earth, gravity can be explained by Newton’s Laws, but at great distances, such as from space satellites, gravity is explained by General Relativity.
The two satellites of the GRACE project are flying 137 miles above our planet. A finely tuned microwaved ranging system measures the distance between the two satellites as they pass over matter as gravity anomalies over Earth. More can be found at
http://podaac.jpl.nasa.gov/gravity/
But what are the gravity anomalies from actual microwave data between the two satellites in space really sensing? What are gravity readings from space measuring? Can ancient mass movements of matter on earth be recorded as gravity readings independent of time? That is the topic of the GRACE Blue/Red Theorem.
“Intuitively intrinsic gravitomagnetism may be thought of as that phenomenon such that the spacetime geometry and curvature change due to currents of mass-energy relative to other matter.”
In classical mechanics the use of Euclidean space instead of spacetime is used, because time is perceived as developing at a constant rate that is free of the observer. In relativity, time cannot be separated from three dimensional space, because time depends on velocity and the strength of gravitational fields, which can slow the passage of time as seen by an outside observer from far away. “Spacetime tells matter how to move; matter tells spacetime how to curve.” wrote famed American theoretical physicist John Wheeler. Herman Minkowski, Einstein’s math teacher explained it as ” Henceforth, space by itself, and time by itself, are doomed to fade away into mere shadows and only a kind of union of the two will preserve an independent reality.”
Abstract: The Blue-Red Grace Theorem posits that gravity data taken from two data collecting space satellites (The GRACE project, NASA’s Gravity Recovery and Climate Experiment) of Earth’s crust, is data taken far enough away, as predicted by Einstein, to not adhere to Classical Mechanics, but to General Relativity, with gravity being the warping of space time. The theorem is based on Einstein’s insight into what gravity is, the warping of space-time fabric. Einstein’s field equations are used by astrophysicists to adjust small movement in space, such as GPS data, to fit relativity, which are small adjustments, but gravity data taken of earth from space by microwave sensing between two satellites theoretically shows mass warping space /time. The movement of mass is recorded as blue and the accretion of mass is recorded as red in the GRACE maps of the globe produced by NASA. The data shows ancient very large movements of mass warping space/time that point to ancient geological events. Time is relative in the data. The gravity data, according to the theorem, shows ancient movements of mass in blue associated with volcanoes, bolides, plate tectonics, and also mass accretion in red associated with hot spots, sea floor spreading, and mountain building. This data shows mass movement events warping space/time in the past, as opposed to the way geophysicists use gravity data on earth to show density of material in the present. The data points to a large ancient volcanoes over Hudson Bay, the Indian Ocean, the Congo Basin, the Mediterranean, along with accretion of mass in The Ring of Fire in plate boundary zones, the Mid-Atlantic Ridge, in addition to other mass movements over time. There are mass ancient movements in Afghanistan, the Himalayas, bolide events, hot spot accretion, plate boundary events, etc.
Click here for animation of visual GRACE data provided by NASA
Main Section Discussion
Astrophysicists study Classical Mechanics and Relativity because of the distances used in their study. Geophysicists’ study is based on Classical Mechanics because the short distances they use as they describe the geology of Earth, and the experience of Newtonian physics solving all the necessary geophysical equations on Earth.
Geophysicists and geologists have used gravity anomalies over landforms for the past century for petroleum and mineral prospecting with great success using the Classical Mechanics of Newtonian physics. Newton’s Three Laws of Physics and Universal Law of Gravitation (1687) are sufficient at smaller scales to prospect for oil and minerals by understanding mineral density. Bouguer Gravity Anomaly Maps (1735), Gauss’s Law for Gravity (1828), and Euler Deconvolution Methods Maps (1735) are tools used by geophysicists today, all based on Classical Mechanics, to understand current mineral density below the surface of the earth with great success at small scales. Gravimeters are used in on-earth calculations, and do not match gravity data taken with microwave calculations from space.
At larger scales, such as maps generated by satellites around the earth, relativistic analysis and reference frames developed by Einstein’s ideas on relativity and gravity can theoretically explain large-scale Earth geological gravity anomalies. Einstein’s Theory of General Relativity helps to explain gravity as related to mass and time, and that the curvature of space-time is directly related to the energy and momentum of whatever matter and radiation are present, and that time is relative. His new thoughts about gravity were outlined in 1915 in his “Theory of General Relativity” Paper, which followed his 1905 “Special Relativity” Paper. He defined gravity as the warping of space/time. “We can therefore always regard an infinitesimally small region of the space-time continuum as Galilean………Space-time regions of finite extent are, in general, not Galilean, so that a gravitational field cannot be done away with by any choice of co-ordinates in a finite region.” “The gravitational field transfers energy and momentum to the “matter,” in that it exerts forces upon it and gives it energy;”[1]
NASA’s gravity field satellite mission GRACE portrays large gravity anomalies over landforms around the globe as measurements that are taken at very large distances by satellite. The visual maps are published here
Einstein wrote that Newton and Galileo’s formulas would work at smaller scales, and weak gravitational fields, but Relativity would show at larger scales.
The GRACE map gravity anomalies, using Einstein’s definition of gravity, point theoretically to large-scale movements of mass over time. These are not related to the small Einstein field equation calculations or the small Lens-Thirring effect calculations of satellites in space. Some of the event’s are well defined in time and nature of these actual large mass movement events, yet some are not well defined, but point to past large-scale events of mass movements that may have led to some previous extinction events. This paper will outline some of the large gravitational anomalies that are outlined by satellites from far distances found on the Earth’s gravity anomaly maps produced by the GRACE project.
Gravity was first outlined mathematically in 1687 by Isaac Newton based on the works of Galileo Galilei and Johannes Kepler. Newton’s opus “Philosophiæ Naturalis Principia Mathematica” used the inverse square calculation for explaining how two bodies attract each other with a force that is directly proportional to the product of their masses and inversely proportional to the square of the distance between them. Newton was unsure if gravity was “ether” or some other force. He wrote “I have not as yet been able to deduce from phenomena the reason for these properties of gravity, and I do not feign hypotheses”.[3] Gravity must be caused by an agent acting constantly according to certain laws; but whether this agent be material or immaterial, I have left open to the consideration of my readers.” (Newton 2004: 102–3) letter to Bentley.
Pierre Bouger, a polymath in France in the 1700’s, further developed the Newtonian mathematical equations for addressing gravity over varied earth surfaces. His name is still attached to Bouguer Gravity Anomaly Maps, which are still used by geophysicists today, defining mineral density using differences in gravitational measures. In the 1700’s, the Swiss mathematician Leonhard Euler developed planar graph theory, which led to further mathematical understanding of gravity readings for geophysicists according to Classical Mechanics. Euler Deconvolution Methods Maps, which are in use today by geophysicists, are named after him. In 1828, the great German mathematician Johann Carl Friedrich Gauss, developed what is now known as “Gauss’s Law for Gravity”, which uses vector fields to account for curvature of the earth, and led to simpler gravitational readings. Gravitational anomalies have been uses by geologists, geophysicists, and prospectors since the early 1900’s with the development of gravimeters. R. von Eotvos’s development of double-beam torsion balance, first used over the Egbell oilfield in Slovakia in 1915, led to gravimeters being used to explore for petroleum. Gravity data became more important to the petroleum industry in 1922, when a positive gravity anomaly at the cap rock of Spindletop dome in Texas led to an oil boom. Since then gravity anomalies have been further developed for geological prospecting. The oil and mineral industries have led to refined instruments at a small scale (compared to global scale) that use Newtonian physics to determine potential valuable results. Bouger Gravity Anomoly Maps, Gauss’s Law for Gravity, and Euler Deconvolution Methods Maps, and gravimeters are tools used by geophysicists to ascertain mineral density below the surface of the earth with great success at small scales using Classical Mechanics.
Einstein’s Relativity, Lense-Thirring Effects, and Lorenz Transformations are used by astrophysicists to analyze gravity and time in Space, based on Einstein’s insights on the subject of gravity. Under most conditions Newton’s Three Laws and Universal Theory of Gravitation are sufficient to study a geophysical area by developing Bouger Gravity Anomaly Maps. At a larger scale though, such as satellite readings of gravity anomalies on Earth, Einstein’s theories can help explain these large-scale gravity readings.
Einstein wrote “One day in 1907 “there came to me the happiest thought of my life,” namely that “the gravitational field has only a relative existence.”” “The theory of relativity is intimately connected with the theory of space and time.” [4]
In 1915 Einstein’s General Theory of Relativity was published, which proposed a new theory of gravitation in place of Newton’s insights on gravity. Einstein came to the remarkable understanding of gravity not as a special separate force, but the relation of mass, energy, and space-time. In Einstein’s Theory of General Relativity, gravity is a distortion of space-time. The curvature of space-time is directly related to the energy, mass, and momentum of the matter present. “It must be remembered that besides the energy density of the matter there must also be given an energy density of the gravitational field, so that there can be no talk of principles of conservation of energy and momentum for matter alone. ” “The gravitational field transfers energy and momentum to the “matter,” in that it exerts forces upon it and gives it energy; “[5]
Scientists validated Einstein’s theories using The Perihelion of Mercury, strongly influenced by the mass of the Sun. The precession was shown to match Einstein’s study exactly, which led to the verification of his theories in May 1919. Current GPS systems use Newtonian physics to account for a position to be determined from a space satellite, but without a relativistic equation added, the GPS system becomes inoperable in less than 24 hours. Gravity measurements taken from space satellites also are large enough of a distance to require relativistic analysis. Einstein- “This conception (relativity) was certainly justified as long as we were dealing with spaces of the order of magnitude of those that astronomy has to do with. ” [6]
The Lense-Thirring effect was developed with Einstein in 1918. The effect predicted “frame dragging” of a sphere spinning in space like our Earth. In correspondence with Einstein, two Austrian physicists, Joseph Lense and Hans Thirring, developed the frame dragging idea of a sphere warping space/time at certain rates. Gravity anomalies data taken from satellites in space and pointed at Earth would have the Lense-Thirring effect of relativistic frame dragging. Frames showing “past” warping of mass by space/time gravity anomalies can be seen from long distances such as from satellites. Newtonian physics cannot explain satellite data.
On March 17, 2002, NASA with others, launched twin satellites named The Gravity Recovery and Climate Experiment (GRACE) project to record Earths gravitational field. (http://www.csr.utexas.edu/grace/) The two satellites (nicknamed “Tom” and “Jerry”) measure the difference in the distance between them using super precise instruments to make gravitational field measurements at very long distances from Earth. The GRACE team then publishes gravity anomaly maps. These maps show how much the Earth’s actual gravity field differs from the gravity field of a uniform, featureless Earth surface. The anomalies highlight variations in the strength of the gravitational force over the surface of the Earth over time. The GRACE Maps are published as color-coded data on global maps. The maps of gravity anomalies are expressed in units of milliGals. The GRACE project has measurements and maps hundreds of times more accurate than predecessors. NASA and DLR under the NASA Earth System Science Pathfinder Program jointly implement the GRACE mission. A future launch of two new satellites is being implemented in cooperation with the German Aerospace Center. This data is not taken using gravimeters as used on Earth by geophysicists, but the two Satellites use comparative microwave data in space to get precise data of differences in gravity on the surface of the earth, plotting the anomalies as graphic data. The gravity data is then processed into color coded maps, hence the title of the paper, “The Grace Blue Red Theory”.
The gravity data from the Grace project has been interpreted as maybe glacial rebound, yet the data does not support this. Some gravity data is in areas that have not experienced glacial movement, and there is no gravity data in some areas of the globe that have had intense glaciation. The gravity data does correspond to igneous plutonic material on earth’s surface though. What is most interesting to those interested in the earth’s geologic past is that the more accurate Grace maps gravity data theoretically portray ancient signatures of large movements of mass on earth using Einstein’s definition of gravity. Large-scale gravity anomalies on earth can be detected over very long distances from space by the twin satellites and gravity anomalies can describe past large movements of mass over space/time using Einstein’s theories. Basically these large-scale gravity anomalies show the movement of large amounts of mass as a distortion over space/time. But in order to interpret the GRACE data Classical mechanics techniques, such as Bouger or Euler Analysis, should not be used. Relativistic analysis should be used because of the great distance of the gravity data as predicted by Einstein. The gravitational data sets, which are then interpreted into color maps, actually show mass warping space/time. Relativity and geological history of the Earth are needed to accurately analyze the GRACE Maps. Classical Mechanics will not explain the data from the GRACE satellites, yet the data is a blueprint for Earth’s geological history in millions of years, but not many billions of years. The GRACE maps are a treasure trove of the history of the planet’s past mass movements over space/time.
These anomalies can be traced to sea floor spreading, earthquake mass movements, mountain building, heavy minerals, or events like meteors or comet impacts of all sizes. They can also portray earth-building events like hot spots, volcanoes, and plate movement zones. The GRACE Maps are a visual display of gravity as large mass movements distorting space/time on Earth.
In looking at the GRACE maps (http://www.csr.utexas.edu/grace/) one immediately notices different gravity anomalies that are present in the graphic data, blue representing lower gravity readings, and warmer tones of yellow and red representing higher gravity readings. The blue tones show mass movement in past space/time, and the red tones show mass buildup due to geological events in space/time using Einstein’s definition of gravity. The Grace Maps show a relativistic map of the movement of mass over space/time because they are at a very large scale of satellite to earth readings.
What is also interesting is that some really ancient events are not shown as anomalies, they go back too far in time to still have a gravity signal detected by the GRACE satellites. The reference frames are too old for some past events on Earth to show up as gravity anomalies. Einstein’s insights about gravity as a distortion mass causes in space/time show that the gravity anomalies from billions of years ago are no longer detectable by the GRACE satellites. Such events that are not shown by the GRACE maps include the theoretical Theia impact, which theoretically created the Moon between 4.40 and 4.45 billion years ago and South Africa’s Vredefort meteor impact which created a large crater 2.02 billion years ago. The Grace Maps do show events, as Einstein’s definition of gravity predicts, with very old signatures whose exact time frames have yet to be more precisely determined, but are hundreds of thousands and millions of years old.
This paper will describe a number of prominent low gravity zones (represented by blue) and high gravity zones (represented by red) as calculated by the GRACE satellites, and also point out other areas of interest. There is much more astrophysical and geophysical interpretation of the GRACE maps to be done using relativistic physics that point to older events.
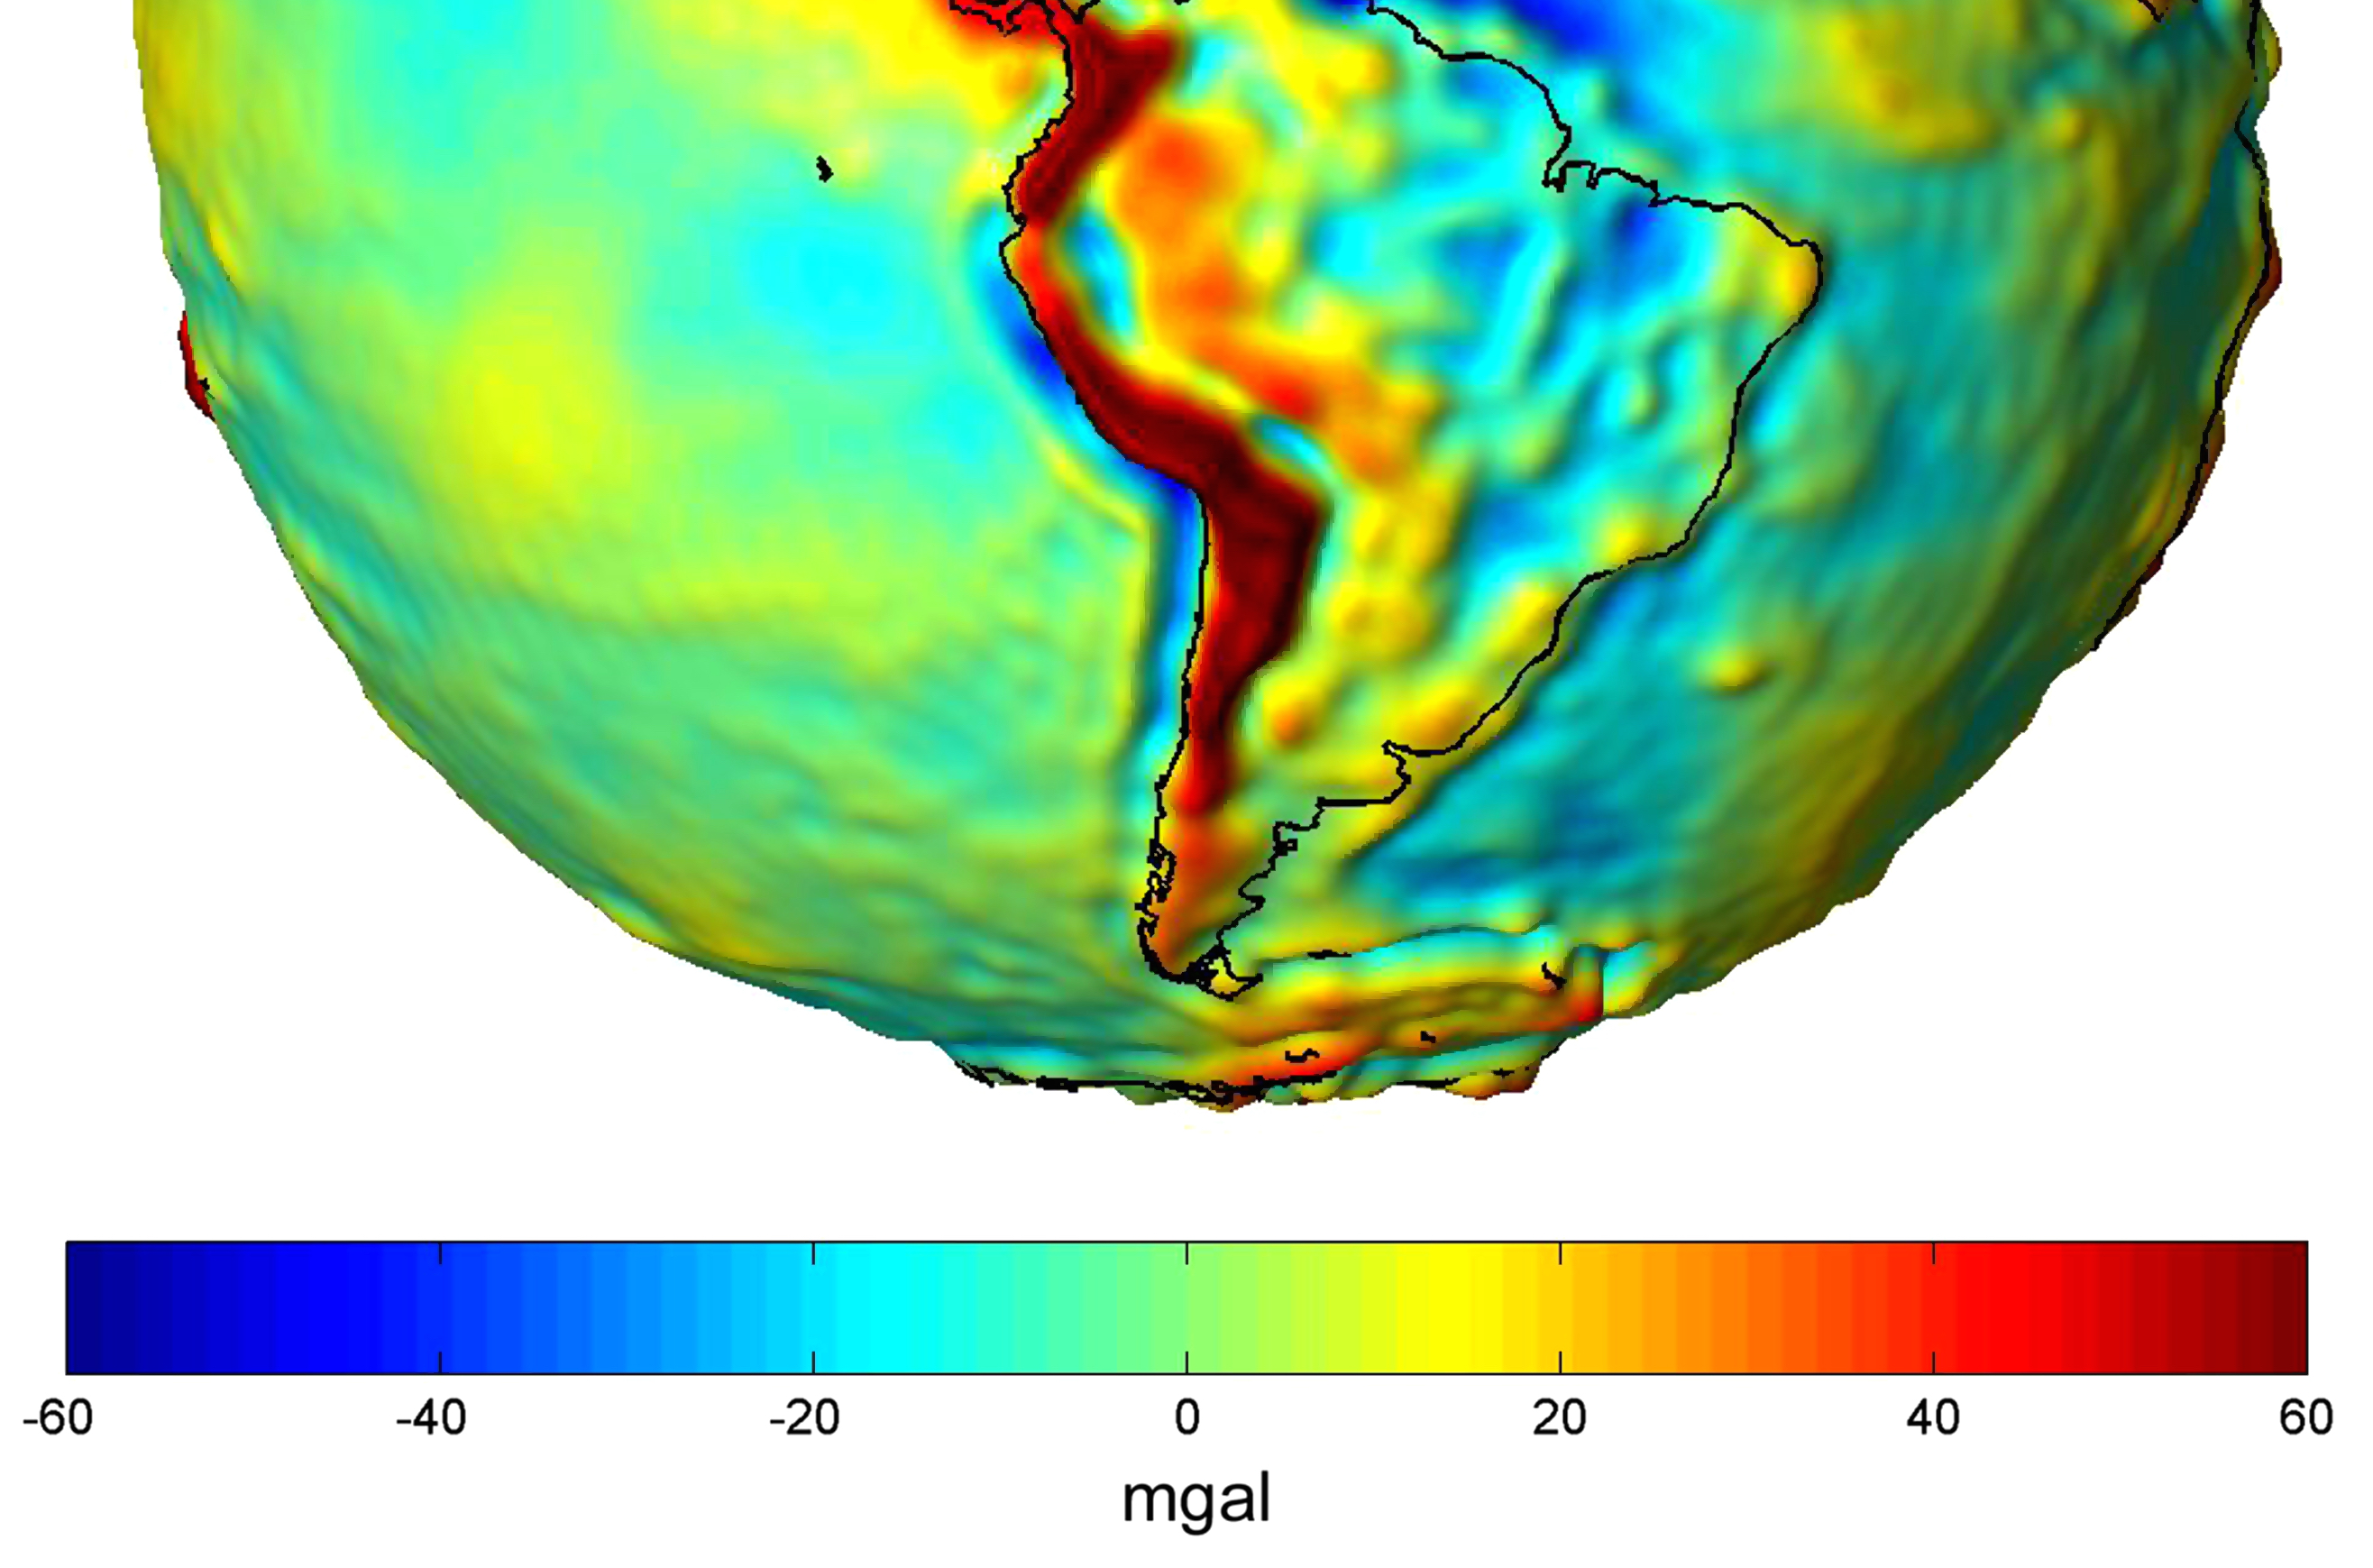
Description of Visuals on GRACE Gravity Maps:
Chile, Western Coast of South America- This is an area well known to geophysicists as a subduction zone of plates colliding.  In this area of the GRACE maps one can see a linear low blue gravity zone and a correspondingred high gravity zone. We know this to be a convergent body of orogenic tectonic plates that is now a subduction zone. During the Jurassic era ( 201 million years ago to 145 million years ago) the Andes were formed and are shown on the Grace maps as high gravity red, while the zone from where the mass movement was coming from is shown as low gravity blue. These are events that happened in the past, yet show up as current gravity readings from satellites. That is because the readings are taken from far away by satellite and are showing the relativistic definition of gravity as the movement of mass in space-time.
Using Classical Mechanics on the ground with Bouger Anomaly Maps one can define the mineral density in the region, but the satellite readings from the GRACE project show graphics of gravity anomalies that show movement of uplift at the subduction zones that have happened in the past as a distortion of mass over space/time. What is shown is a linear subduction zone and mountain building of mass over space/time shown as gravity as Einstein defined it, gravity as the warping of mass over space/time. A Classically trained geophysict would try to intrepret the GRACE data using Newtonian physics to try to understand mineral identification through mineral density, but a physicist trained in Relativity, could read the GRACE graphics as the past relativistic frame of mass warping space/time. Because we know the history of the Western Coast of South America’s geology, we can see the GRACE map is actually portraying a past event of mass movement.
Indian Ocean– A very large anomaly with a low gravity reading is over the Indian Ocean. This was a very large-scale event that is associated with the multi-million year break up of India and Australia when the Australian Continent was connected to the Indian/Asian continent in the supercontinent Gondwanaland. During the Cretaceous period (145-66 million years ago) the plates between India and Australia began to separate, and there is evidence of enormous volcanism.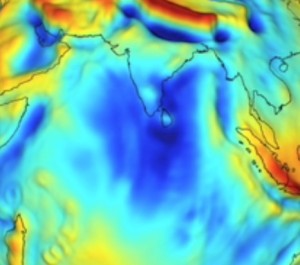
The nearby Deccan Traps, a very large igneous province in India, formed between 60 and 68 million years ago, and may be associated with the mass movement blue low gravity zone. The low gravity readings in the Indian Ocean shown by dark blue area are also where two tectonic plates meet. It is also the area of the Reunion Hotspot, which moved from south to north during this time period along with sea floor spreading. The deep gravity readings point to an exceptional amount of mass movement in a past era. I have named this event “ Agni”, Hindu for fire. The Cretaceous geology of India and Australia, which includes vast amounts of igneous minerals, can be related to this event. There is debate about whether this is a basalt flood plain or a mantle plume. This event probably had a very long time span. The event’s signature of enormous plutonic material in the vast region and extremely low gravity readings points to hot spot movement with super-volcanos, basalt flood plains, or mantle plumes. The current analysis of the Indian Ocean gravity anomaly is Newtonian though. More analysis of the Deccan Traps, and the Indian Ocean and Australian geological history can explain this gravity anomaly. Some recent data on the area was published relating the area to the end-Cretaceous mass extinction.
What is also interesting about the gravity graphic of the Indian Ocean is the apparent cone shape of Sri Lanka.
The Himalayas, which were formed by the break up of the Indian platform moving north around 50-55 million years ago, also show enormous deep blue mass movement and red accretion of mass in the graphic above.
I believe that the large gravity anomalies over the Indian Ocean and Himalayas are ancient mass movements warping space/time shown in current gravity readings from space satellites as predicted by Einstein’s General Relativity. The Deccan Traps, which have been associated with the K-T extinction event, occurred at the boundary between the Cretaceous (K) and Tertiary (T) time periods, around 66 million years ago. The K-T event led to the extinction of more than three quarters of all plant and animal species. The questions that remains are why are the Deccan Traps farther away from the mass movement blue zone, was this a pyroclastic event, and have the areas between the Deccan Traps and the deep gravity zones moved in the ensuing 66 million years?
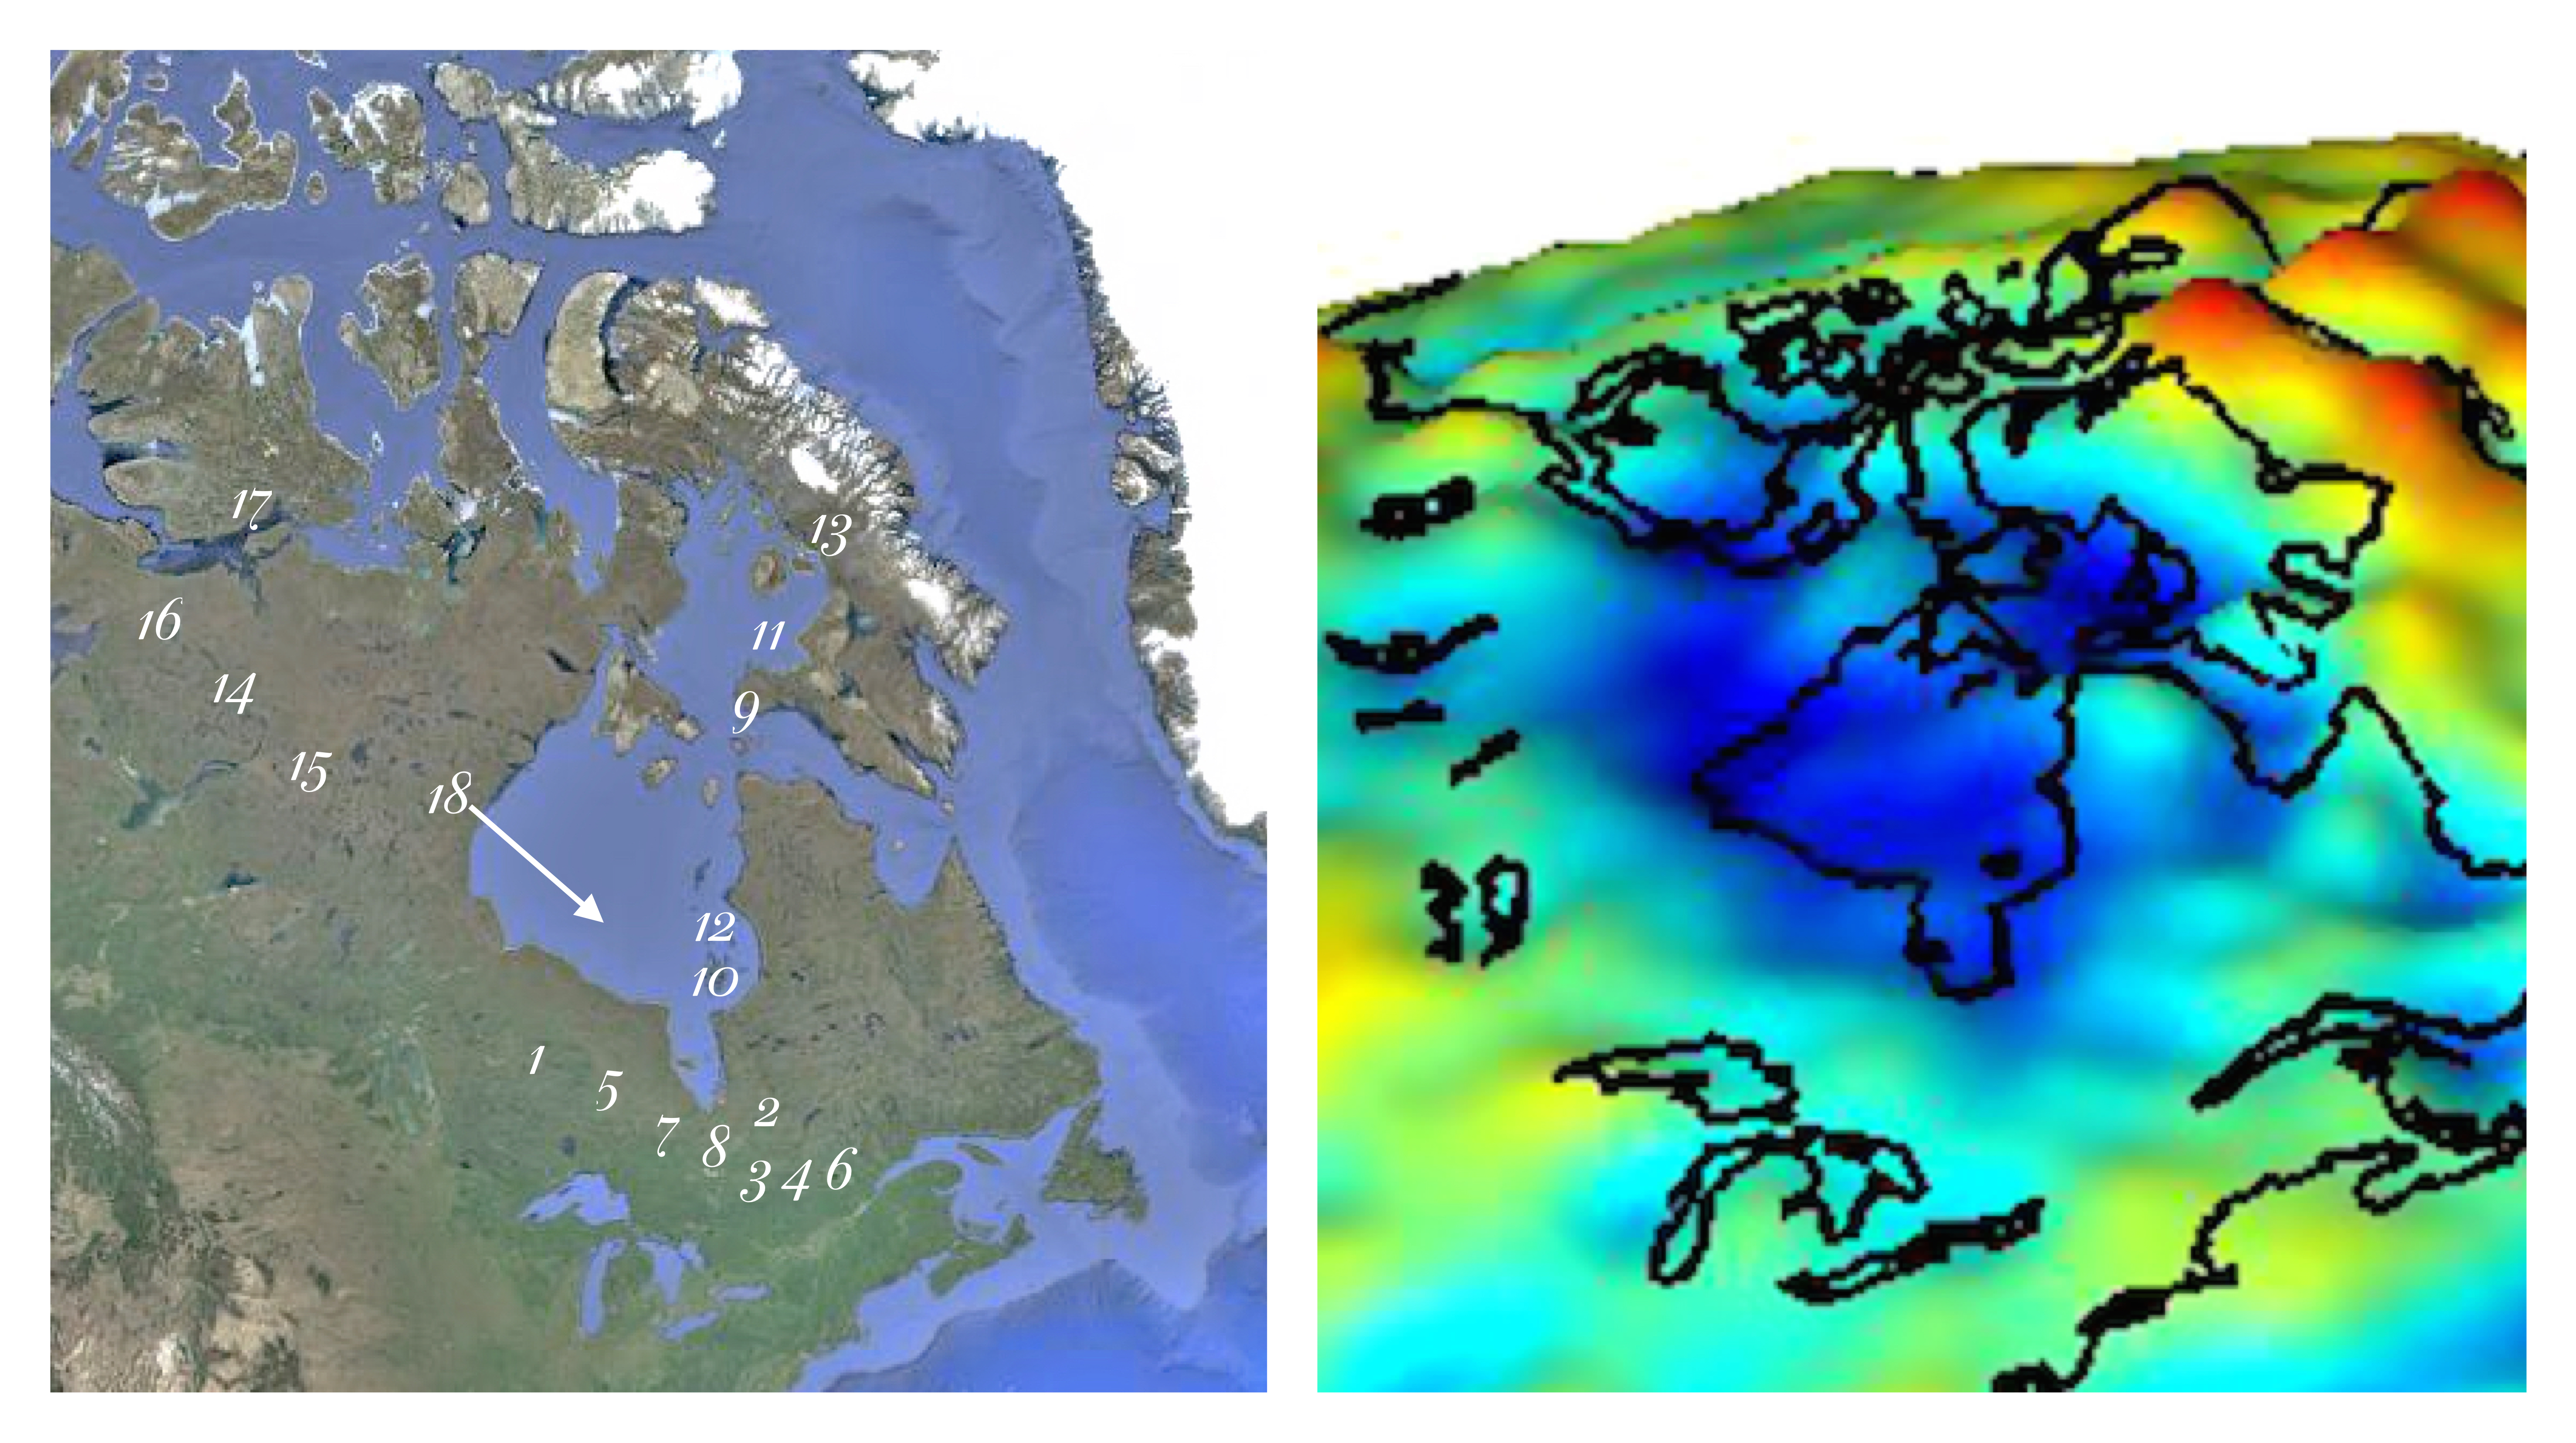
Hudson Bay There is a large ovoid gravity anomaly with a deep negative reading over the area of Hudson Bay and surroundings:
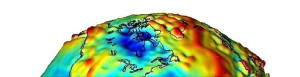
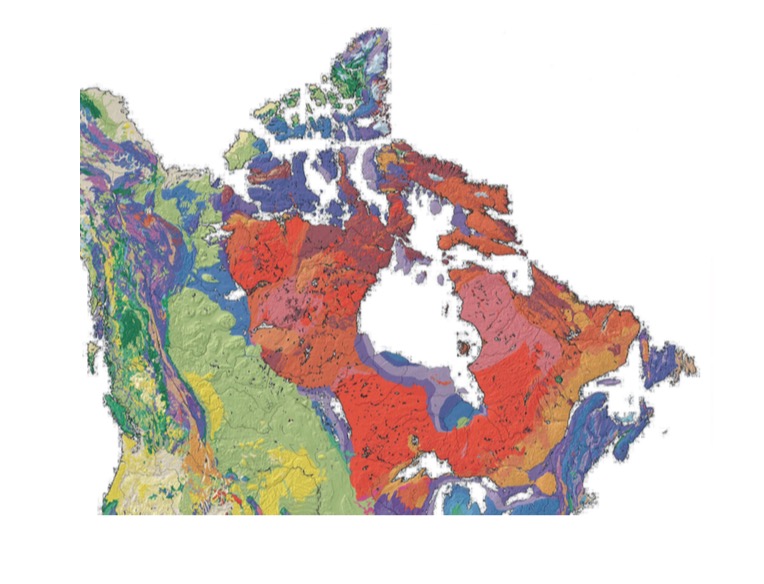
There is also what appears to be a number of large igneous provinces and ancient calderas in the area of Hudson Bay shown on Canadian geology maps:
 Government of Canada Digital Geology Maps
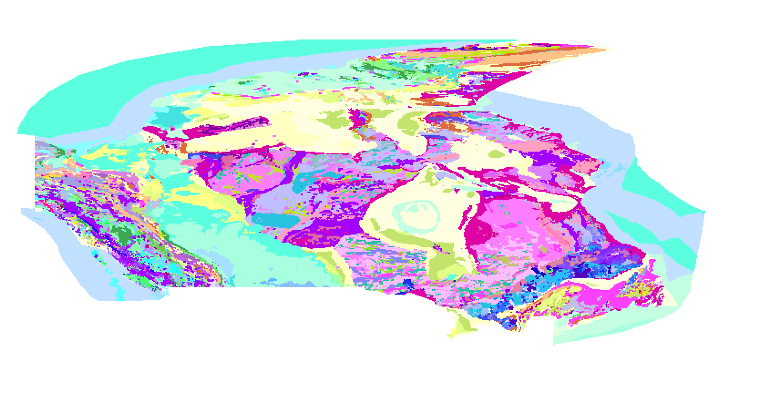
Scientists have postulated that this gravity zone is related to the glacial rebound, but the past glaciers were not oval, and did not leave gravity anomalies elsewhere on the globe. Scandinavia also has a history of glacial retreat and rebound, but does not have an enormous round negative gravity reading like Hudson Bay; so glacial rebound cannot be the source. Also there are negative gravity readings in areas where glaciers have not historically happened, such as the Democratic Republic of the Congo in Africa. Scientists have also postulated that Hudson Bay could be related to an ancient meteor hit, but no bolide evidence is found.
The Hudson Bay geology is a complex series of craton building and large igneous events with many data sets.
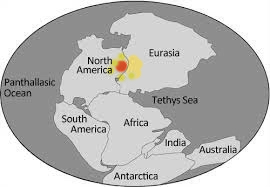
The craton building era in billions of years ago in former Pangea: 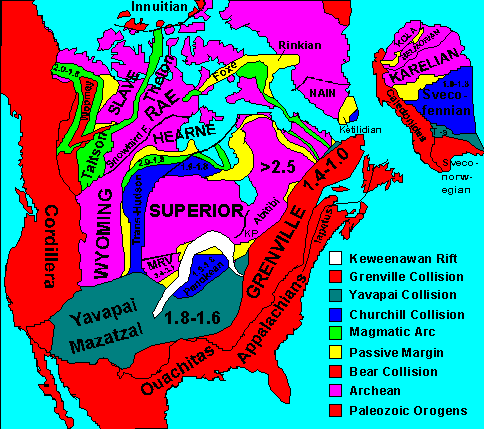
The dates for different igneous events in the area range from millions of years ago:
Verified Hudson Bay Area Igneous Events:
(MA) – Millions of Years Ago- Click on Event to see associated technical papers:
1. Red Lake, Ballmer Assemblage 2992-2958
2. Opatica 2807-2718
3. Misema 2704- 2707
4. New Senator 2701-2704
5. Sturgeon Lake 2700
6. Norunda Caldera 2696
7. Swaze Belt 2690
8. Abitibi 2677
9. Lona Bay 2310 – 2409
10. Eskimo Harbour 1960
11. Schooner Harbor 1898 – 1803
12. Flaherty Island 1870
13. Baffin Island 1842-1820
14. Coppermine 1270
15. MacInzie 1267
16. Hottah 780
17. Franklin 723
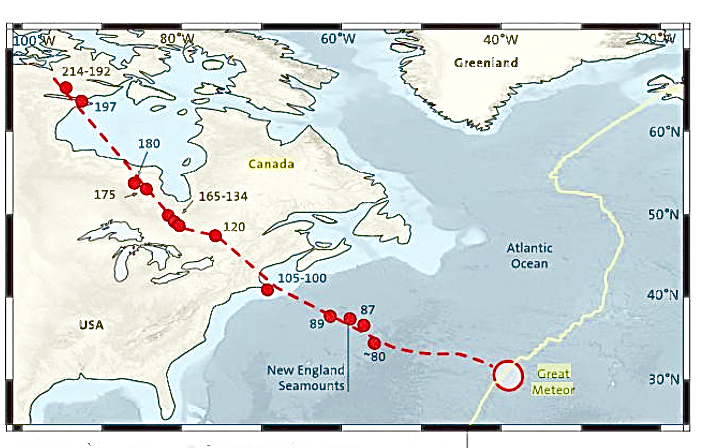
18. Great Meteor Hot Spot 214?- 80? MA
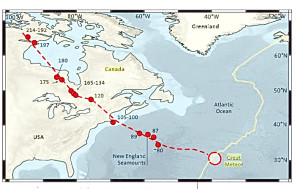
Track of the hot spot of the Great Meteor Plume as reconstructed from dated magmatic rocks (Van Fossen and Kent, 1992, Heamen and Kjarsgaard, 200) Ages in millions of years (From Plate Tectonics: Continental Drift and Mountain Building By Wolfgang Frisch, Martin Meschede, Ronald C. Blakey)
There are also three large circular areas that potentially show evidence of igneous origin that need further study: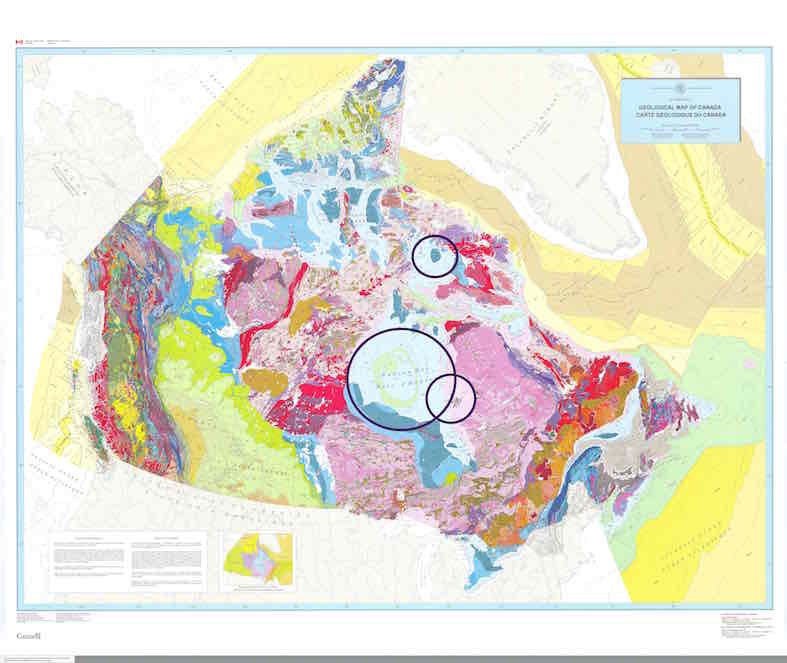
In the southern area of Hudson Bay on the map there is there is also an igneous source of deep magma iron surrounding an area of Hudson bay called the Nastapoka Arc. The Arc forms a circular area in southern Hudson Bay. Although the area has been scoured by glaciers forming and receding over time, the circular arc keeps it’s shape because it has bands of iron formation. A description of the area’s geology in 1907, before iron mining, is profiled in this book which highlights igneous volcanic geology in the area.
It is also interesting to note that where the current Hudson Bay Region and Nunavut is now was formerly at the Permian /Triassic boundary of geologic time was right next to the Siberian Traps, which have been recently dated at the P/T boundary event time:
The Siberian Traps are enormous volcanic lava flows, also known as a large igneous province, in Russia without a known origin source, yet they flow north south from a source: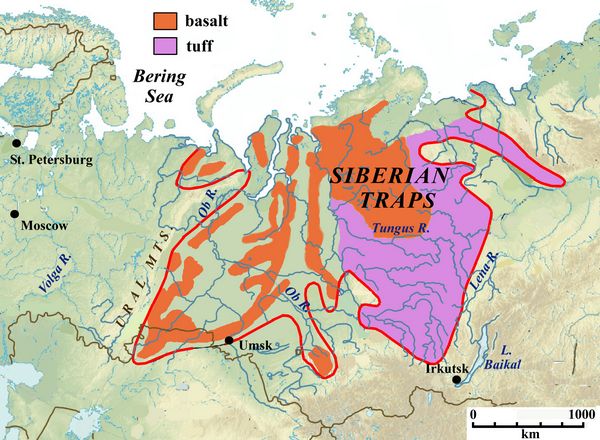
There is also a evidence of P/T boundary extinction event in the area. There are ash deposits in Nunavut Canada associated with P/T event. There are also volcanic deposits at 252 million years ago on the northern Pangea area. There is also striking similarity between the composition of an area of the Siberian traps and northern Canada, Nunavut.
I believe the evidence is for an many ancient volcanic mass movements in the Hudson Bay region, some recorded, some not. I have named the particular north central Hudson Bay event “Ikkuma”, Inuit for fire. The other ancient large volcanic event in Hudson bay created the Nastapoka arc, and I will refer to it as Nastapoka. I believe a number of ancient large super-volcanic events happened in the area of what is currently Hudson Bay, but millions of years ago when the area was part of Pangaea, before the formation of the Atlantic Ocean. Most of the events have been dated in the 3000 Ma to 1000 Ma timeframe, but New England Meteor hotspot mantle plume which crossed the area started northwest of Hudson Bay 1000MA crossing northwest to south east trough the region, with the mantle plume stopping in the Atlantic 83 MA years ago. This crossing is possibly related to the Siberian Traps and the P/T boundary event at 252 MA, but has yet to be proven or not. Hudson Bay is surrounded by plutonic igneous material of various ancient ages. The large gravity anomaly over the Hudson Bay region, using Einstein’s definition of gravity, points to an enormous movement of mass that distorted space/time. The fact that the gravity anomaly is basically round or oval either points to an extraterrestrial impact or a super-volcano. No bolide evidence is found.
The Igneous Volcanic Pre-Cambrian Canadian Shield in Red:
 region, such as shocked quartz or iridium anomalies, yet ancient volcanic plutonic material is everywhere surrounding Hudson Bay. The massive low gravity reading and amount of ancient volcanic material strains the imagination, yet the evidence is there to see. Following Einstein’s definition of gravity, we are looking at a frame of space-time with a massive amount of mass movement in an ancient setting when Earth was very active volcanically.
Geologists have studied Hudson Bay for signs of an impact bolide event with no apparent evidence, yet enormous amounts of igneous material in the Canadian Shield surrounding Hudson Bay. The Canadian Shield, which surrounds Hudson Bay is a large area of exposed Precambrian igneous and high-grade metamorphic rocks that forms the ancient geological core of the North American Craton.
The event, like the large gravity sink over the Indian Ocean, probably happened at a plutonic hot spot associated with movement of magma during plate tectonic shifts and continent building. Many glaciations have also affected the shape of Hudson Bay. The Abitibi greenstone belt surrounding Hudson Bay is the source of many valuable minerals which are all igneous plutonic in origin. The Ikkuma event can also be proven to be a bolide impact structure with igneous plutonic aftermath during the Achaean era when both large volcanoes and impact structures were numerous on earth, but the local evidence points to an ancient volcanic event
The Hudson Bay gravity anomaly is probably oval because it encompasses a chain to the south of documented super volcanic events in an arc of associated rifting of an ancient Achaean plume.
There is also a large blue low gravity zone between Northern Greenland and Ellsmere Island that shows evidence of ancient igneous movement of large amounts of matter. This area, The Nares Straight, is the focus of a paper which points out separation of North America and Eurasia, the slip faults, and volcanic sandstone in the area.: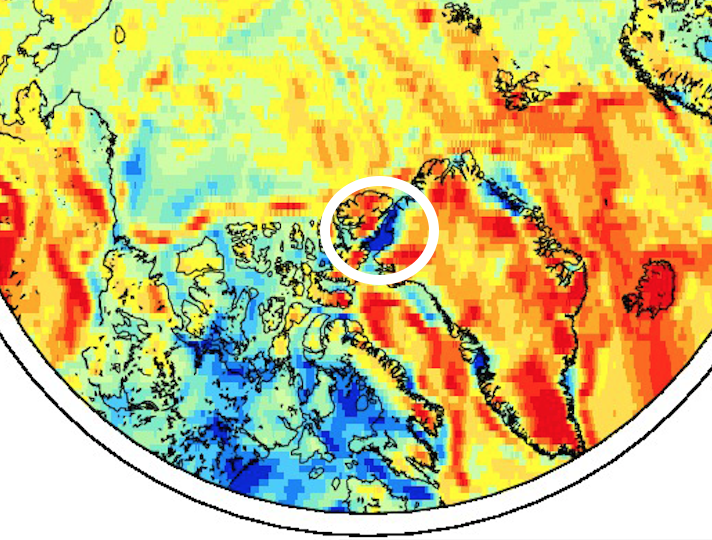
The Ellesmere Island area needs further study of mass movement along with the other gravity signatures in the Hudson Bay region and the edges of Greenland: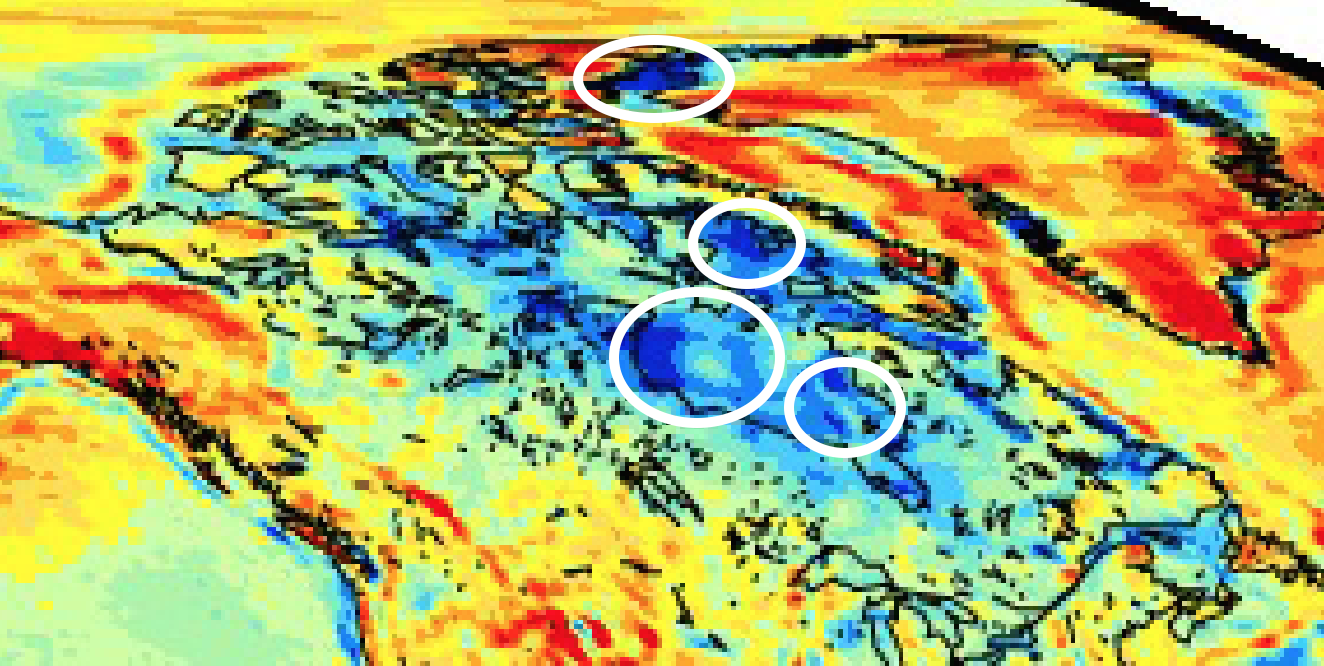
Western Mid-Atlantic 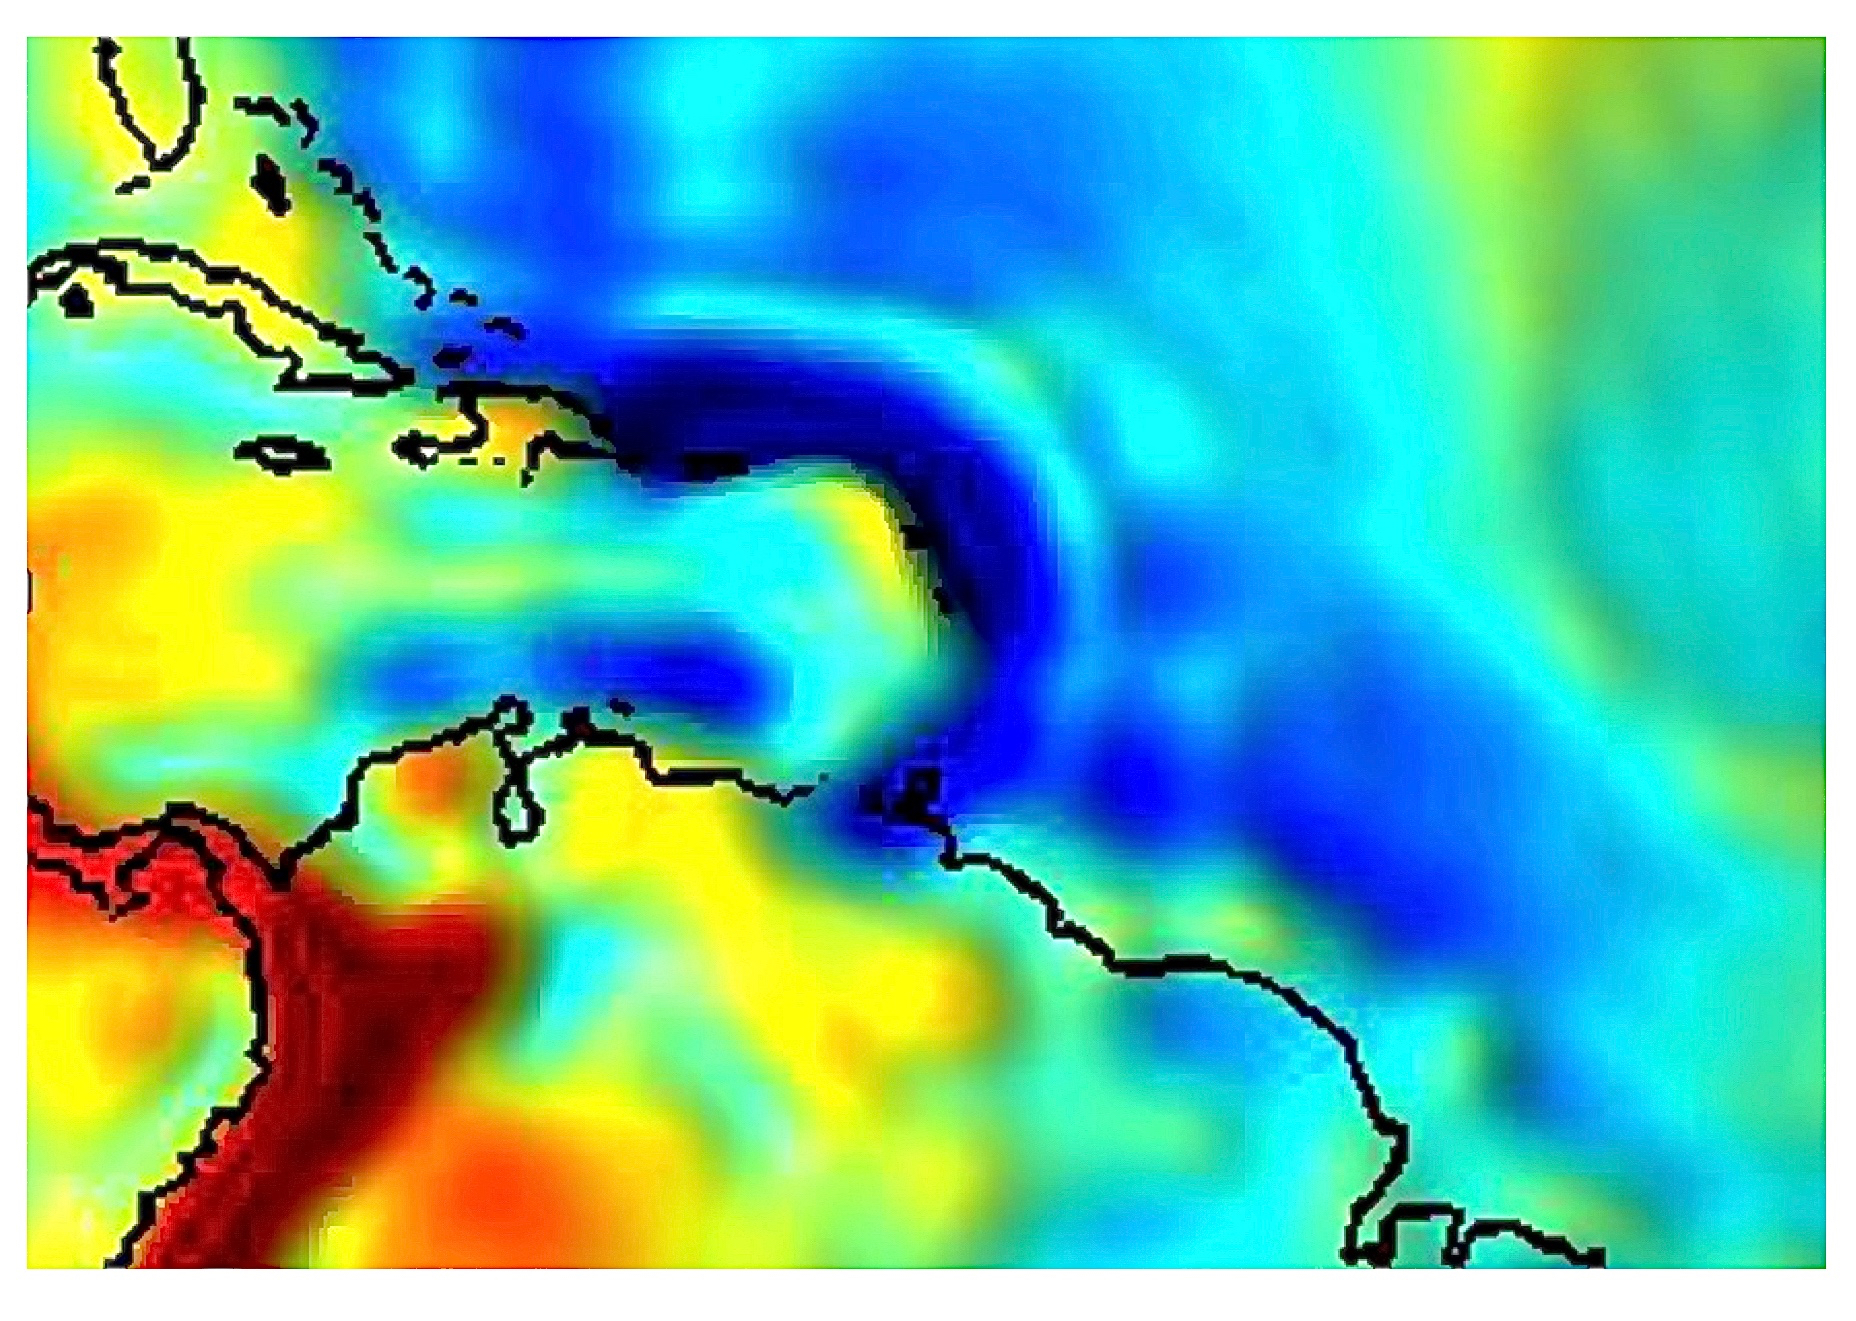 In the western Mid-Atlantic Ocean there is also a large low gravity zone of blue on the GRACE maps that stretches north of Caracas, Venezuela surrounded by an arc of low gravity surrounding the Caribbean Sea. This area is a tectonic plate subduction zone that also has high volcanic activity. The Puerto Rican Trench has the lowest gravity reading on earth (-380 milliGal) showing extreme mass movement. Why is there an arc of low gravity? Why is there a low gravity zone at center of arc? What mass movement formed this geometry? I have named this event “Dife”, the Creole word for fire.
Hellenic Trench The Hellenic Trench is a deep curved trench that has the deepest readings of water in the Mediterranean. The area is an active subduction zone of the Aegean plate and the African plate. The Grace maps show a very low gravity zone, and the geology shows ancient mass movement activity associated with the subduction zone. 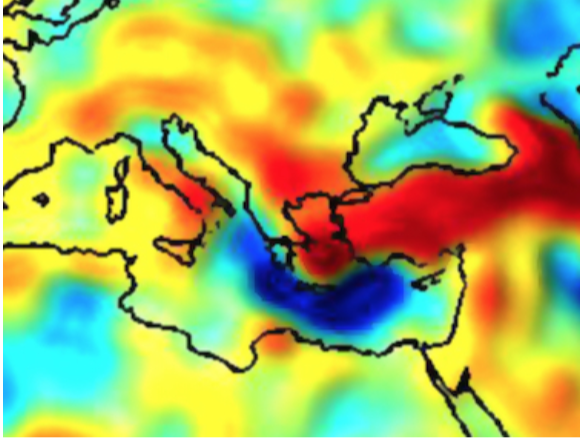 Numerous volcanic and earthquake events have occured in this area. I have named this event “Fotiá”, Greek for fire. What left this massive gravitational marker is clearly associated with the African Plate meeting the Aegean Plate subduction zone. Is it an ancient volcanic marker? Why is it curved? Is the surrounding red zone associated with accretion of matter part of the same event? Is the low gravity reading one mass movement event or a long time period of multiple events? The Hellenic Trench low gravity curved arc needs more answers.
As can be seen in the following graphic, the Aegean Trench and the Puerto Rican Trench are similar plate subduction zones with volcanoes, island formation, and evidence of ancient mass movements as the plates collided:
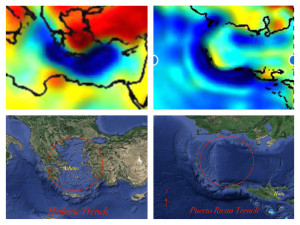
Hellenic Trench Puerto Rican Trench
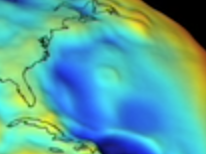
Chicxulub Crater
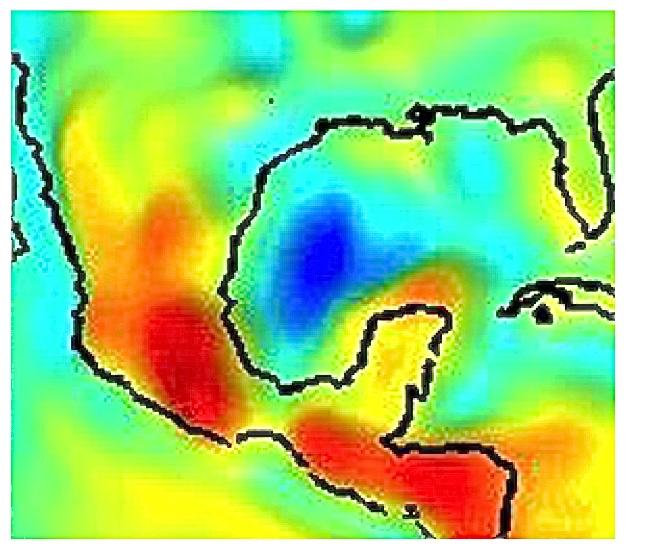 There is also a blue low gravity zone in the Gulf of Mexico, which signifies mass movement over time, which can be seen in the GRACE maps, but also yellow higher gravity zone. This probably relates to the Chicxulub Crater, which was formed by an impact bolide more than 66 million years ago. Evidence besides the gravity anomaly includes shocked quartz and tektites. The Chicxulub event has been debated to be the leading cause, also with the Deccan Traps, as leading to the Cretaceous-Paleogene, or K-PG event, that led to the extinction of the dinosaurs.
The Chicxulub Crater was named after the closest town in the Yucatan, and was found by geophysicists Tony Camargo and Glen Pentfield while working for the Mexican oil company PEMEX in 1978. Once again, the gravity signature is relativistic, past enormous movements of mass showing as a current gravity frame from space data.
The Hawaiian Islands Chain
The Grace satellite data of the ancient island chain shows an example of the Grace Blue/Red theory premise of old massive movement of matter showing as low gravity data with associated volcanic circles and newer accretion of matter showing as yellow to red with higher readings. The older chain, The Emperor Seamount Chain has eroded over millienia, but still shows a low gravity blue as a signature of mass movement as predicted by Einstein’s definition of gravity, with the newer islands that we know as recent accretion of matter. Notice the round old ancient volcanos with calderas in centers measured by gravity readings showing mass movement.
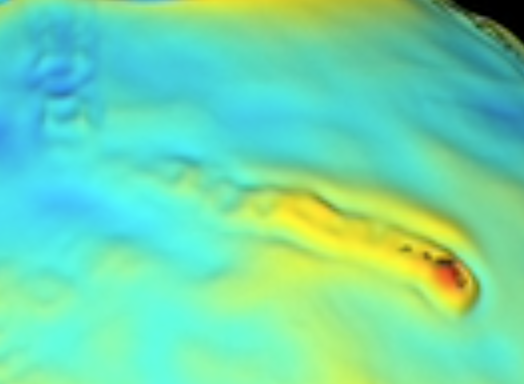
Congo Basin. The Democratic Republic of the Congo has a very large circular gravity signature that also corresponds to a very large circular geological structure that covers one third of the country from Kisangani to the east, the Congo River to the north, and Lusambo to the South; The Congo Basin, also known as “Cuvette Centrale”.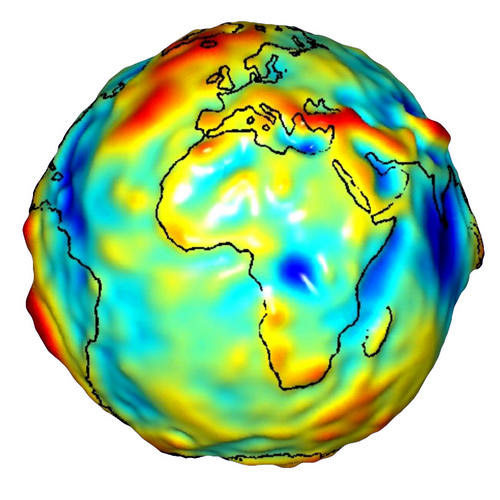
What created this circular gravity reading in Africa, and why does it have such a large gravity anomaly? It is a reading of a large amount of mass movement over space-time if you follow the Einstein definition of gravity. Is it an astrobleme? Is it a caldera? The Congo Basin is defined as an ‘inter-cratonic depression.” The separate Tanzanian Craton and Western Rift borders the Congo Basin to the east. Crystalline high velocity shear structures are below the Basin. Seismic high shear velocity structures that extend to 250 km depth have been noted beneath the Congo craton (Ritsema & van Heijst, 2000). A large greenstone belt rich with gold and other minerals surrounds the Congo Basin. Greenstone belts are basically metamorphosed volcanic material in origin, and also surround Hudson Bay. Minerals of igneous origin found in the 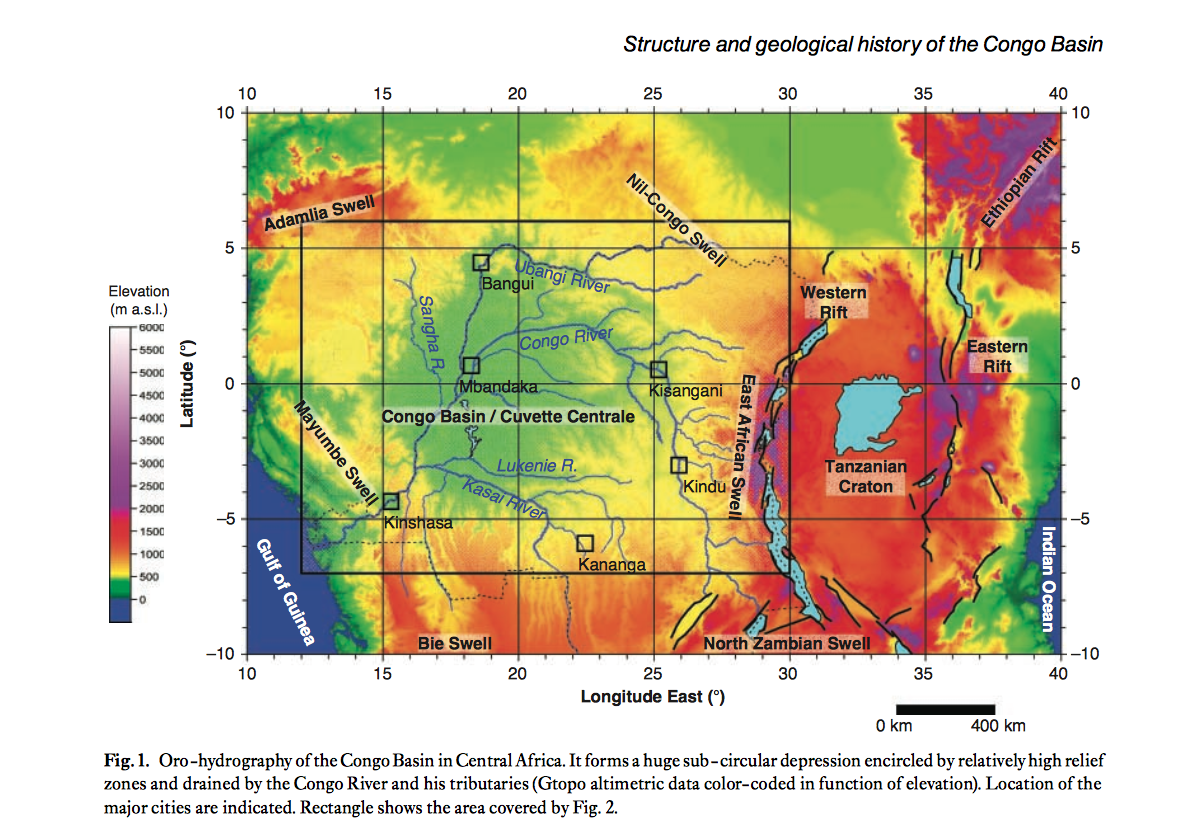 DRC include copper, gold, tantalite, cassiterite, wolframite, quartz, and granite. All of these minerals are constituents of veins and pegmatite from ancient volcanic intrusions. Evidence points to a massive mantle plume. There are over 600 illegal mines in the Congo Basin this year, mines that extract high value volcanic materials, and thousands of small scale legal mines. The mining is also leading to threatened status of the local gorillas. The current research on the Congo Basin is outlined in several papers, none of them with a relativistic analysis of the GRACE gravity data. The Katangan DRC Copperbelt surrounds the Congo Basin. Copper is formed from the lava and minerals that occur during volcanic activity.
 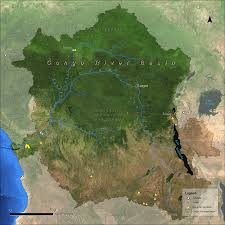 All of the evidence points to another large ancient igneous event. The evidence, in what is currently the Democratic Republic of the Congo, includes the enormous circular gravity anomaly, and the super abundance of igneous minerals associated with a large circular greenstone belt, the mantle plume geology, and a river system running around a large inter-cratonic depression. I have named this event “Moto”, Swahili for fire. The Moto event can also be proven to be a bolide impact structure with igneous plutonic aftermath.
The Mid-Atlantic Ridge
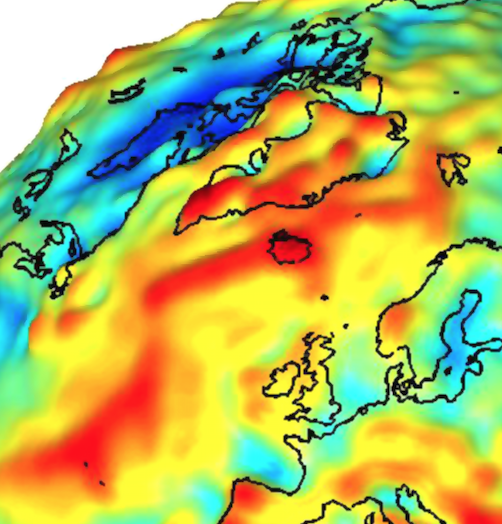
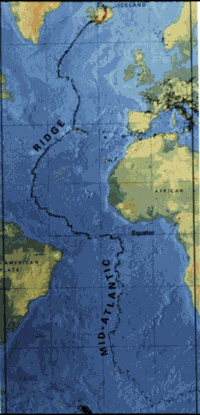
The Mid Atlantic Ridge is a divergent tectonic plate that separates the Eurasia Plate and the North American Plate in the North Atlantic Ocean, and separates the African and the South American Plate in the South Atlantic Ocean. Magma from the Earth’s mantle reaches the deep seafloor and comes up in the rift valley and contributes to the 2 cm. of spreading that happens each year. Along the Ridge there are volcanoes, such as in Iceland, which are relatively recent, and add to accretion of material along the Ridge. The Grace Satellite Map data shows high gravity readings marked as an enormous long red zone of material accretion along the Mid-Atlantic Ridge.
The Bermuda Seamount
The Bermuda Seamount is an ancient large volcano, of which the Island of Bermuda is on one small edge. The GRACE gravity data shows the whole of the ancient volcano and the center of the caldera.
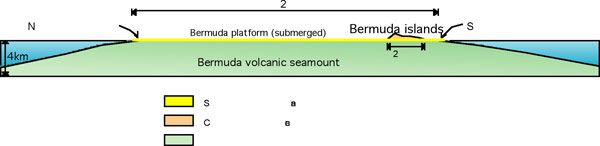
What is striking is how small a remnant of the ancient volcano are the current Islands of Bermuda, yet the GRACE gravity maps show the whole ancient volcano and the movement of mass.
The New England Seamount Chain
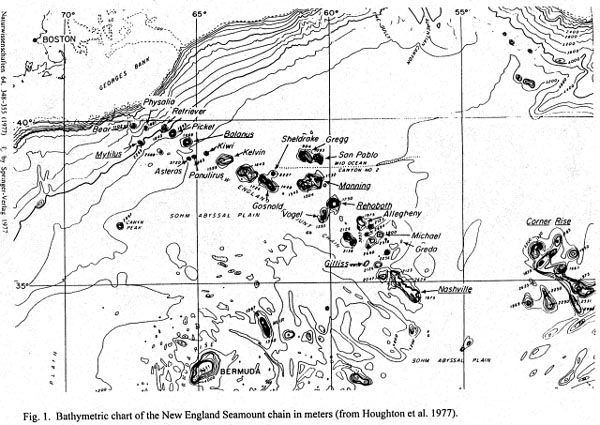
North of Bermuda on the GRACE maps on the Bermuda Map above you can notice another smaller volcano associated with the New England Seamount Chain. Which one of the volcanos in the chain was large enough to show up on the GRACE maps is in need of further study.
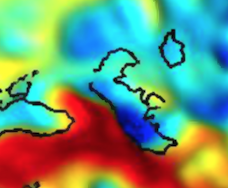
The Comoros Archipelago
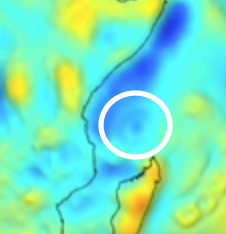
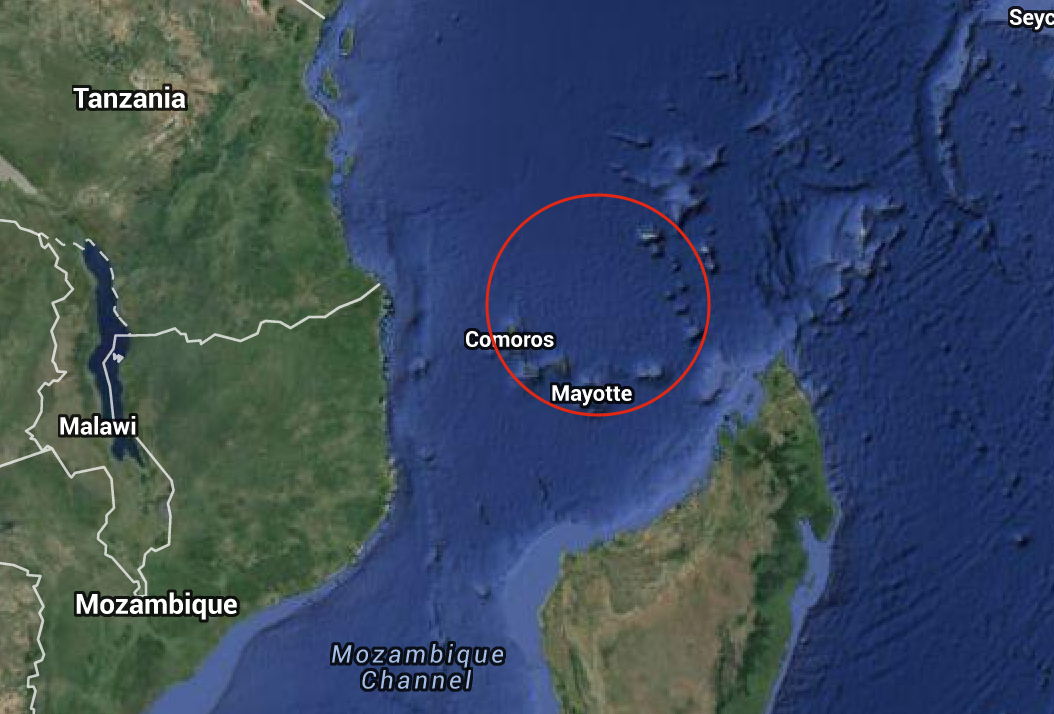
The Comoros Archipelago area exhibits a clear circular volcanic structure from gravity data on the GRACE Maps. It also corresponds with a circular volcanic island structure of the Comoros Archipelago north of Madagascar. Similar to the Aegean and Caribbean, the Comoros Archipelago has smaller islands, yet evidence of an ancient large volcano that shows on the GRACE Maps.
The Asian Ring of Fire
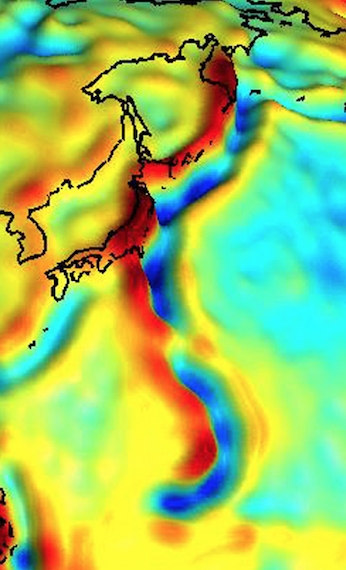
Like South America’s Ring of Fire Coast, the Asian Ring of Fire on the Grace Maps show the dark blue ancient movement of material in the plate collision earthquake zones, and the accretion of material as the plates subduct marked by red on the maps. The very active Eastern Russian and Japanese past earthquakes show on gravity maps as mass movement.
East Indian Ocean
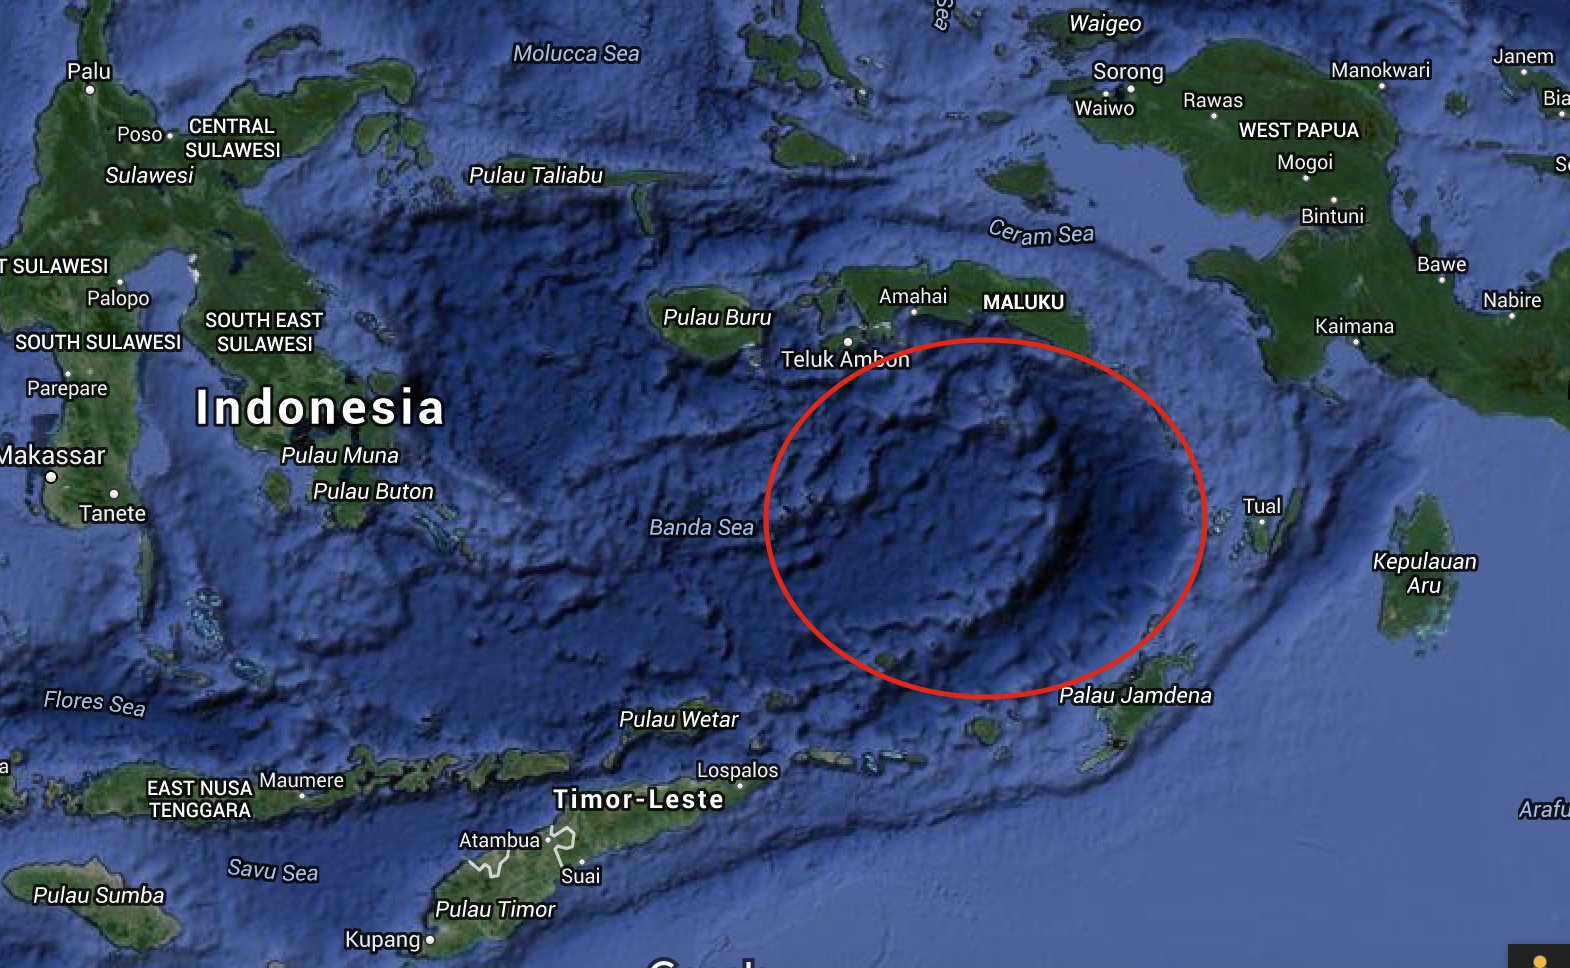
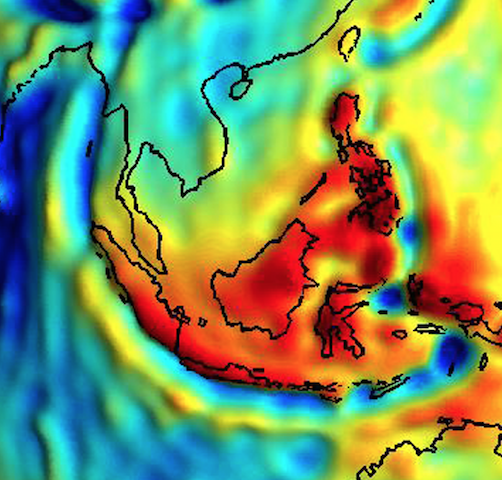
The Eastern Indian Ocean has a volcanic arc in the area of three converging and colliding major plates, the Indo-Australia Plate, the Pacific Plate, and the Eurasian Plate. A very large blue zone marks the end of the Banda Arc, with two round blue circles above it to the north. This area has been the site of earthquakes and volcanos as seen by the mass movement of material.
Oman
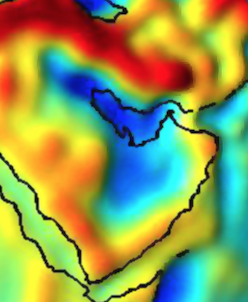
Oman is an ophiolite obduction zone, meaning there were plate subduction zones that created uplift such that sea fossils are found on top of the mountains. Oman is very well studied geologically because of petroleum reserves. Oman’s rich geological history can be found here. The Grace gravity maps show enormous movement of mass in the area.
Caspian Sea
The Caspian Sea was formed by ancient rifting of plates forming an oceanic basin. There is still an active earthquake and volcano zone in the region. The area shown on the Grace maps shows massive movement of matter.
Conclusion: There are many more “blue and red” zones on the GRACE gravity maps that need further study such as Brazil, Antarctica, Russia, China, the Himalayas, Afghanistan, and others.
What is also interesting is that all the major mining corporations in the world operate near deep gravity anomalies such as Canada, Africa, Australia, etc. because that is where the valuable plutonic material on earth such as gold, copper, diamonds, and rare earth minerals valuable to technology are found.
The GRACE maps offer a treasure map of geological history to geologists and geophysicists. Although some very early events in Earth’s history are too old to be portrayed in the frame of mass movements outlined by the maps, several relatively past large-scale geological events are portrayed. Because geophysicists have been trained in Classical Mechanics, there has not been a through analysis of the GRACE Maps using the large-scale relativistic definition of gravity by Einstein of the warping of space-time by mass. Astrophysicists, Physicists, Geophysicists, and Geologists can collaborate together to date the large-scale events, and to define them as impact structures, volcanoes, plate movements, sea floor spreading, hot spots, earthquakes, or other geological events in the past that would still leave a gravity signature. Some of these events are probably associated with the large extinction events in Earth’s history, and need further study and dating. Classical mechanics should not be used to interpret the GRACE Maps because of the distance that the satellites were from the gravity data.
The Grace Blue Red Theory states specifically that “The gravity data and corresponding color coded maps of the Gravity Recovery and Climate Experiment satellites, conducted by CSR, JPL, NASA, GFZ, and DLR, launched in 2002, have produced gravity data that conforms to General Relativity, showing the movement of mass warping space/time. The data shows past geologic events that will add to our knowledge of Earth’s geologic history”. In conclusion the Grace Blue Red Theory, in my opinion, passes a test of scientific validity, in that every blue zone matches on the ground geology verification for past mass movement over time, and every red zone matches on the ground geology verification for accretion of mass over time. Clearly Einstein’s Theory of Relativity verifies that gravity is the warping of space/time by mass in the NASA maps.
To see an animation of the GRACE maps see:
http://svs.gsfc.nasa.gov/vis/a000000/a003600/a003655/geoid_640x360_30fps.mp4
Acknowledgements- Acknowledgements go to the Grace Project Partners for their incredible work and data. GRACE is a joint partnership between the National Aeronautics and Space Administration (NASA) in the United States and Deutsche Forschungsanstalt für Luft und Raumfahrt (DLR) in Germany. Dr. Byron Tapley of The University of Texas Center for Space Research (UTCSR) is the Principal Investigator (PI), and Frank Flechtner of the GeoForschungsZentrum (GFZ) Potsdam is the Co-Principal Investigator (Co-PI). Project management and systems engineering activities are carried out by the Jet Propulsion Laboratory. The whole mission of the NASA Grace program can be found at http://science.nasa.gov/missions/grace
References:
The Collected Papers of Albert Einstein
by Albert Einstein, Translated by Anna Beck
Peter Havas, Consultant, Princeton University Press, 1989
The Principia: Mathematical Principles of Natural Philosophy, Sir Issac Newton, 1687
republished by Univ. of California Press, Oct 10, 2014
Fundamentals of Geophysics, William Lowrie, Cambridge University Press; 2 edition 2007
Global Tectonics, by Philip Kearey Keith A. Klepeis , Frederick J. Vine, Wiley-Blackwell; 3 edition, 2009
Gravity: Newtonian, Post-Newtonian, Relativistic Eric Poisson, Clifford M. Will, Cambridge University Press , 2014
[1] The Collected Papers of Albert Einstein, Volume 7:
The Berlin Years: Writings, 1918-1921.
Albert Einstein, Translated by Alfred Engel Engelbert Schucking, Consultant,
Princeton University Press 2002
[2] The Meaning of Relativity: Including the Relativistic Theory of the Non-Symmetric Field: Including the Relativistic Theory of the Non-Symmetric Field (Fifth Edition) by Albert Einstein, Princeton University Press 2014
[3] The Principia: Mathematical Principles of Natural Philosophy, Sir Issac Newton, 1687
republished by Univ of California Press, Oct 10, 2014
[4] The Genesis of General Relativity: Sources and Interpretations, Michel Janssen, Jürgen Renn, John Norton, Tilmann Sauer, John Stachel
Springer Science & Business Media, Feb 16, 2007
[5] ” “
[6] The Genesis of General Relativity: Sources and Interpretations, Michel Janssen, Jürgen Renn, John Norton, Tilmann Sauer, John Stachel
Springer Science & Business Media, Feb 16, 2007
[7]Jan. 2015 “U-Pb geochronology of the Deccan Traps and relation to the end Cretaceous mass extinction”, Science